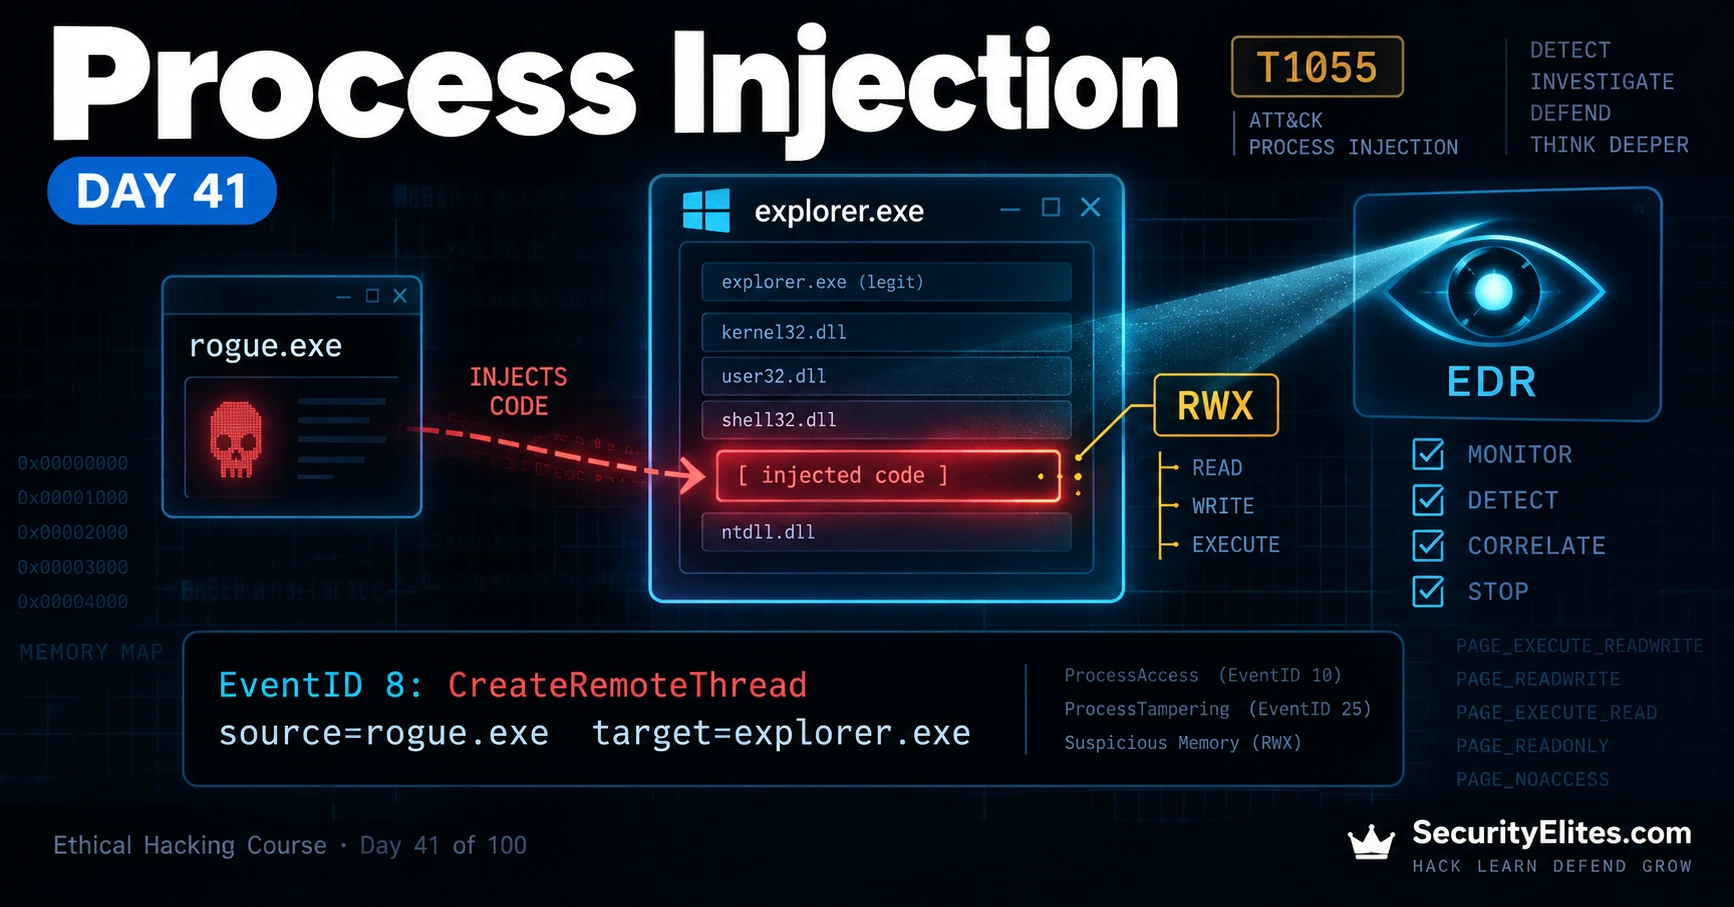
Part of the Ethical Hacking 100-Day Course
explorer.exe. That’s what makes this technique so interesting — and why EDR tools watch it so closely. I’m not going to teach you how to build an injection attack or give you something you can turn into a weapon. Instead, I’m going to walk you through it from my defender’s chair: what I look for, which signals make me suspicious, and how I connect those clues during an investigation. My goal is simple — by the end of this lesson, when you see process injection happening, I want you to recognize it almost instinctively.🎯 What you’ll master in Day 41
⏱ ~28 min read · 3 hands-on exercises · detection-focused lab
Sysmon64.exe -c newconfig.xml without reinstalling.Process Injection — Table of Contents Day 41
Before we start, I want to be straight with you about today’s lesson. I know this is an offensive security course, so you might be expecting me to show you how to build a process injector step by step. I’m not going to do that. It’s not because I don’t trust you. It’s because a working, copy-and-paste injector can be turned into a real weapon very quickly, and I don’t believe I need to put that online to teach you the subject properly.
What I can give you is something more valuable: a deep understanding of what process injection looks like from the defender’s side. I’ll show you what happens, what evidence it leaves behind, which behaviors make me suspicious, and how I would investigate those signals. Once you understand the detection side properly, the offensive mechanics start making a lot more sense too. That’s the skill I want you to take away from this course — not just knowing how an attack works, but understanding the consequences of every action and knowing how to recognize it when you see it.
How Process Injection Works — Conceptually
Before we go any further, I want to be clear about how I’m teaching this lesson. I won’t give you code for building a working process injector. Instead, I’m going to walk you through the concept step by step so you understand exactly what the attacker is trying to accomplish and, more importantly, what those actions look like from the defender’s side.
You don’t need a copy-and-paste injector to understand process injection. If you understand the sequence of actions, why each step is necessary, and what evidence those actions can leave behind, you’ve learned the part that matters when you’re actually investigating an endpoint.
01. Choose a Target Process
The attacker first identifies a legitimate process they want to target. A process such as explorer.exe is a useful example because it normally runs on a Windows desktop and therefore doesn’t immediately look suspicious.
The important concept is not the specific process. The attacker wants malicious activity to operate within a process that already has a legitimate reason to exist.
02. Obtain Access to the Process
Once the target has been identified, the attacker needs sufficient access to interact with it. That access is important because manipulating another process requires permissions that aren’t normally needed for ordinary application behavior.
From my defender’s chair, I don’t just ask whether access occurred. I ask who requested it, which process was targeted, what level of access was requested, and whether that relationship makes sense.
03. Place Content Inside the Address Space
This is the central idea behind process injection. Attacker-controlled content is introduced into the memory space of another process.
I’m deliberately explaining the mechanism rather than giving you the implementation or injector code. I want you to understand what is happening inside memory, because that understanding becomes extremely useful when you’re investigating suspicious memory activity.
04. Cause the Content to Execute
Getting content into a process isn’t enough. The attacker also needs a way for that content to execute within the target process.
Different process-injection techniques approach this differently, but the underlying concept is the same: code that wasn’t originally part of the target process is made to execute in that process’s context.
05. Blend Into Legitimate Activity
This is where process injection becomes particularly interesting from a detection perspective. The attacker benefits from the fact that the activity is taking place inside a legitimate process.
That’s why I don’t want you to think about detection as simply asking, “Is this process malicious?” A better question is: “Why is this legitimate process behaving in a way I wouldn’t normally expect?”
That’s the mental model I want you to carry into the rest of this lesson. I haven’t given you injector code, but you now understand what the attacker is trying to accomplish at every stage. Next, we’ll turn that knowledge around and look at the telemetry and behavioral signals that can expose it.
What Injection Is — and Why Defenders Fear It
Let me strip away the jargon for a moment. Process injection is built around one simple idea: make your code run inside someone else’s process. Instead of seeing malware sitting in a process called evil.exe, a defender may see attacker-controlled code operating inside something legitimate such as explorer.exe or svchost.exe. MITRE ATT&CK groups this family under T1055, and you’ll encounter it frequently when studying serious intrusions because it can help attackers hide their activity.
There are three things I want you to understand here. First, injection can make simple process-based blocking less effective because the activity is taking place inside a legitimate process. Second, it can make network activity harder to interpret when communications originate from a process that normally makes network connections. Third, some injection techniques can reduce the obvious artifacts an analyst might otherwise expect to find on disk. Notice the common theme: evasion. Process injection isn’t necessarily how an attacker gets into a system; it’s often something they do after gaining execution, when they’re trying to make that execution harder to see.
That distinction matters. By the time I’m investigating process injection, I don’t want to stop at “I found the injection.” I also want to ask, “How did the attacker get here in the first place?” Injection is often a mid-game technique. Detecting it is important, but understanding the earlier stages of the attack can reveal the bigger story.
The Three Process Injection Families You Must Recognise
You don’t need to build these techniques to detect them, but you do need to recognise what they look like. Each family has a different execution pattern and leaves different clues behind. I’m going to describe them at the level I would use when threat hunting — what the technique is trying to achieve, what makes it different, and what evidence I would look for — rather than turning this into a step-by-step recipe.
1. Classic Remote-Thread Injection
Let’s start with the classic approach. At a high level, the attacker gets access to a target process, places attacker-controlled content into its memory, and causes execution to occur there through a new thread. The important thing for you isn’t memorising the implementation. It’s recognising the relationship: one process reaches into another process’s memory and causes execution inside it.
That cross-process behavior can leave useful telemetry. Sysmon Event ID 8, CreateRemoteThread, can record one process creating a thread in another process. When I see an unexpected process relationship like this, I don’t immediately call it malicious — I investigate why the source process needed to interact with the target in the first place.
2. Process Hollowing
Process hollowing takes a different approach. Conceptually, a legitimate process is created, its normal executable content is replaced or tampered with in memory, and execution is redirected so the process ends up running something different from what its file on disk suggests.
The detection idea I want you to remember is mismatch. The process may have a legitimate name and a legitimate executable on disk, but what I see in memory doesn’t line up with what I expect that executable to contain. Sysmon Event ID 25, ProcessTampering, can provide useful telemetry for this type of behavior.
3. APC and Other Queue-Based Injection
The third family uses a different execution path. Instead of creating a new remote thread, attacker-controlled execution can be associated with an existing thread through mechanisms such as asynchronous procedure calls. The idea is to make the target execute the content as part of its existing execution flow.
This can make the behavior less obvious if I’m only looking for remote-thread creation. But the underlying problem remains: something has to get attacker-controlled content into the target process. That means I can still investigate the surrounding memory operations, execution behavior, thread activity, and the relationship between the processes involved.
—————————————————————
Remote-thread cross-process thread creation Sysmon EID 8
Process hollowing image on disk != code in memory Sysmon EID 25
APC / queue-based RWX memory, no file backing Volatility malfind
All of them a process opened with VM_WRITE Sysmon EID 10
🧠 EXERCISE 1 — THINK LIKE A HACKER (10 MIN · NO TOOLS)
Reason about evasion the way an attacker does, so you can anticipate them:
- An attacker wants their command-and-control traffic to blend in. Which process would they most want to inject into —
notepad.exe, a browser process, orcalc.exe? Why? - Of the three families above, which would an attacker pick if their only goal was to avoid a “CreateRemoteThread” alert? What do they give up to get that?
- You’re the defender. If every family has to write into foreign memory, why can’t you just alert on all cross-process memory writes? (Hint: think about what legitimate software — debuggers, some anti-cheat, accessibility tools — also does.)
Why Process Injection Beats Naive Defences
This is where I want to change the way you think about defence. Beginners often defend the wrong layer. If your security model is simply “block bad filenames” or “match known-bad signatures,” process injection can slip past that logic because the process itself may be completely legitimate, and there may not be an obvious malicious file sitting on disk.
That’s why modern endpoint detection focuses heavily on behaviour. Instead of asking, “Have I seen this file before?” I want you to ask, “Did this process just do something that doesn’t make sense for what it normally does?” A browser unexpectedly interacting with a sensitive process, or a trusted executable whose in-memory contents don’t match what I expect from its file on disk, gives me a behavioural signal worth investigating.
The key idea is simple: behaviour-based detection is looking for the technique, not just the malware sample. That matters because a previously unseen piece of malware can still exhibit behaviours that are familiar to a defender.
A Concrete Detection Example
Let me put this into a situation you might actually see in a SOC. Imagine an unfamiliar user-space process suddenly interacts with explorer.exe. The access is unusual for that application, and shortly afterward the target process shows unexpected executable memory activity.
I wouldn’t look at that first event and immediately declare, “This is process injection.” That’s not how I want you to investigate. I’d build the timeline first: Which process initiated the access? Which user launched it? What permissions were requested? Did memory activity follow? Was there unusual thread activity? Did the target subsequently load anything unexpected or make a network connection?
Now imagine those events line up within the same short time window. At that point, I have something much more interesting than a single alert — I have a behavioural chain. The individual events might each have a legitimate explanation, but together they tell a very different story.
Don’t ask, “Which event proves injection?” Ask, “Do these events form a coherent sequence that is consistent with process injection?”
That’s the skill I want you to develop. Good detection isn’t about waiting for one magical alert. It’s about taking small pieces of telemetry and turning them into a defensible explanation of what happened.
The Telemetry That Gives It Away
Now let’s get concrete about the signals, because this is the part you’ll actually use when you’re investigating an endpoint. In a Windows environment, Sysmon can give us valuable telemetry for process-injection investigations. I’ll show you what these events tell me and how I correlate them — not how to trigger the technique.
Here’s how I read these events. Event ID 10 can tell me that one process accessed another process. The details matter: I want to know which process initiated the access, which process was targeted, what access was requested, and whether that relationship is normal. Event ID 8 gives me another important clue when one process creates a thread in another. Event ID 25 can provide evidence of process image tampering, which is particularly useful when investigating techniques such as process hollowing.
I don’t treat any of these events as an automatic verdict. Context matters. A legitimate security product, debugger, administrator tool, or other trusted application may legitimately interact with another process. What gets my attention is the combination of unusual behaviour, process relationships, timing, identity, and memory activity.
There’s another layer I want you to understand: memory itself. Suspicious executable memory that isn’t associated with a normal image or mapped module can be an important clue during memory analysis. But even here, I don’t want you to memorize a single rule such as “executable memory equals injection.” Legitimate software can create executable memory too. What matters is whether the memory characteristics fit the process’s expected behaviour and whether they line up with the other telemetry we’ve already collected.
That’s the mindset I want you to carry into the next section. Don’t hunt for one magical indicator. Build the story from multiple pieces of evidence. When the process activity, memory behaviour, and telemetry all point in the same direction, you have something you can investigate with confidence.
🔍 Practical Analyst Checklist
When I get a suspected process-injection alert, this is the checklist I work through before reaching a conclusion:
- Identify the source: Which process initiated the interaction?
- Identify the target: Which process was accessed or modified?
- Check the user: Which account and security context were involved?
- Review access: Was the requested process access normal for the source application?
- Build the timeline: Did memory, thread, image-tampering, or module activity follow?
- Inspect memory: Are there unusual executable regions or other memory anomalies?
- Check the baseline: Does this behaviour normally occur on this endpoint?
- Correlate: Do process, memory, identity, and network telemetry tell the same story?
- Validate: Could a legitimate application, security tool, debugger, or administrator action explain it?
Hunting for Injection in Memory with Malfind
Now let’s get hands-on in the safe way. We’re not going to inject anything. We’re going to investigate a memory image and look for evidence that code may have been injected into a running process. For this, I’m going to use Volatility, the memory-forensics framework you’ll come back to later in your Kali forensics lessons. Its malfind plugin helps identify suspicious memory regions that may be associated with process injection.
The idea is straightforward: I give Volatility a memory image, and malfind helps me find regions with characteristics that deserve investigation — such as private executable memory, unusual protection settings, or content that resembles executable code. Remember, though: a suspicious memory region is a lead, not an automatic verdict. I still need to investigate the surrounding evidence.
Step 1 — Capture a Memory Image
First, you’ll need a memory image from your Windows lab VM. For a controlled lab, you can use a memory-acquisition tool such as WinPmem to capture the contents of the system’s RAM for later analysis.
Step 2 — Run Malfind Against the Image
Once the memory image is available on my Kali analysis machine, I can ask Volatility to examine it for suspicious memory regions.
Step 3 — Read the Results Like an Analyst
Now I slow down. Seeing PAGE_EXECUTE_READWRITE immediately gets my attention because the region is readable, writable, and executable. That’s an unusual combination for many types of normal application memory, but it isn’t proof of malicious activity by itself.
I then look at the process, the memory region, its protection, whether the region is backed by a legitimate image, and what the bytes appear to contain. If I find executable content in private memory inside a process such as explorer.exe, I have a strong lead. But I still want to correlate it with process-access events, thread activity, image-loading telemetry, the user context, and the process timeline.
- Private executable memory
- Unexpected memory protection changes
- Content resembling executable code
- Suspicious cross-process access
- Unexpected thread activity
- A process relationship that doesn’t fit the normal baseline
This is the important lesson: malfind doesn’t magically tell me, “This machine has been compromised.” It gives me places to investigate. My job is to combine those memory findings with the endpoint telemetry we discussed earlier and determine whether the evidence forms a coherent attack chain.
🛡️ Evidence-Preservation Checklist
Before I start investigating a suspected injection, I want to preserve the evidence properly. My basic checklist is:
- Preserve volatile data: Capture memory as early as practical because RAM contents can change or disappear.
- Record the time: Document the acquisition time and the system’s timezone.
- Document the system: Record the hostname, operating system, user context, and relevant process information.
- Preserve the original: Treat the original memory image as evidence and perform analysis on a working copy.
- Calculate a hash: Hash the acquired image and record the value so I can demonstrate that the evidence has not changed.
- Record the tool and version: Document the acquisition and analysis tools used, including their versions.
- Keep a timeline: Record acquisition, transfer, analysis, and any other significant actions.
- Don’t modify the source unnecessarily: Avoid running investigative tools directly on the affected system unless the response procedure requires it.
- Preserve supporting telemetry: Collect relevant Sysmon, Windows Event Log, EDR, process, and network records alongside the memory image.
⚡ EXERCISE 2 — LAB TERMINAL (15 MIN)
Catch injection in memory without ever performing it. Use a memory image from your own lab VM (snapshot a running Windows VM, or use a training image such as those from the Volatility sample set):
- Run
windows.malfindagainst your image with Volatility 3. - Scan the output for any region marked PAGE_EXECUTE_READWRITE that sits inside a normally-trusted process (explorer, svchost, a browser).
- For each hit, note the PID, the process name, and whether the first bytes look like an
MZPE header. Screenshot your findings.
Writing a Detection That Survives
Finding one suspicious injection in one memory image is useful, but that’s only the beginning. The real job is turning what I’ve learned into a detection that can run across an entire fleet without burying the SOC in false positives. A rule that fires constantly will eventually get tuned down, muted, or ignored — and once analysts stop trusting a detection, its value drops quickly.
The naive approach would be to alert on every CreateRemoteThread event. That sounds simple, but legitimate software can perform cross-process operations too. Instead, I want to add context. I ask: Does the source process normally perform this action? Does the target process normally receive it? What other telemetry happened around the same time?
That’s where baselining becomes important. I first learn what normal cross-process activity looks like in my environment. Then I look for deviations — unusual source and target combinations, unexpected access patterns, suspicious process identities, and related memory or thread activity. The goal isn’t to create the loudest rule. It’s to create a rule that analysts can actually trust.
Notice what I’m doing here. I’m not treating one event as proof of injection. I’m combining a primary signal with additional telemetry and environmental context. I also maintain an approved list for legitimate applications that routinely perform cross-process operations, because those exceptions are part of making the detection useful rather than noisy.
🔍 My Detection Checklist
- Start with a strong signal: Identify the behaviour that initially deserves attention.
- Add correlation: Look for related process, memory, thread, or image activity.
- Baseline normal behaviour: Learn which applications legitimately perform the activity.
- Add context: Consider the user, endpoint, process identity, and timing.
- Document exceptions: Keep legitimate security tools, debuggers, and administration software accounted for.
- Test false positives: Run the detection against normal enterprise activity before deploying it widely.
- Review regularly: Update the baseline as software and infrastructure change.
That’s the shape I want you to remember: signal + correlation + context + baseline. I’m teaching you the logic rather than a copy-paste rule for one particular SIEM because the logic transfers. Whether you’re working with Sysmon, an EDR, a SIEM, or another telemetry platform, the analyst’s job remains the same — find behaviour that doesn’t belong, explain why it happened, and build a detection that people can trust.
⚡ EXERCISE 3 — BUILD A DETECTION (15 MIN)
Turn the concept into something testable in your own lab:
- Write, in plain language, a detection rule for remote-thread injection that includes at least one allow-list condition and one correlation condition.
- List three pieces of legitimate software in a normal Windows environment that would trip a naive “any CreateRemoteThread” rule — these are your allow-list candidates.
- Explain how you’d test your rule’s false-positive rate before trusting it. (Hint: run it against a baseline of normal activity, not against an attack.)
Why This Makes You a Better Operator Too
I promised you at the beginning that the detection lesson was the offensive lesson. Now you can see why. When I understand how defenders hunt process injection, I become a better operator during an authorised engagement. I know which behaviours generate telemetry, which process relationships attract attention, and which actions are likely to leave evidence behind.
That changes the way I approach an engagement. Instead of simply saying, “I can use this technique,” I can ask a much more useful question: “What would the client’s security team see if I did this?” I can then explain where their detection worked, where visibility was missing, and which telemetry could help close the gap. That’s the kind of understanding that turns a technical finding into a useful security assessment.
Someone who simply downloads a tool and runs it without understanding the underlying behaviour learns very little from the result. They may know that the technique worked, but they don’t necessarily understand what happened, what telemetry it generated, or why the same approach might behave differently in another environment.
That’s the lesson I want you to take from today. Understanding defence makes you better at offence, and understanding offence makes you better at defence. You don’t need a weapon-building walkthrough to become a capable security professional. You need to understand the behaviour deeply enough that you can recognise it, investigate it, and explain its impact.
🎯 Your Practice: Investigate, Don’t Inject
Now I want you to put the lesson into practice. I’m not asking you to build or run a process injector. Instead, use an isolated Windows lab VM or a pre-captured memory image and investigate the evidence as if you’ve just received a SOC alert.
- Capture or obtain a lab memory image. Preserve the original and record its hash before analysis.
- Run Volatility’s
malfind. Identify memory regions that deserve further investigation. - Record your findings. Note the PID, process name, memory protection, and why the region caught your attention.
- Review Sysmon telemetry. Look for relevant process-access, remote-thread, and process-tampering events around the same timeframe.
- Build a timeline. Connect the process, memory, thread, user, and network evidence.
- Make a reasoned conclusion. Decide whether the evidence supports further investigation, and explain exactly why.
🧠 Your Analyst Question
You find suspicious executable private memory inside explorer.exe. Sysmon also shows unusual access to the process shortly beforehand. What additional evidence would you collect before calling this confirmed process injection?
That’s your exercise for today. Don’t worry about getting the answer instantly. I want you to practice the investigation process: observe → correlate → validate → explain. If you can do that consistently, you’re building an analyst skill that transfers far beyond process injection.
🧠 Quick check: malfind flags a region inside a signed, trusted process marked PAGE_EXECUTE_READWRITE with no file backing. What’s the single strongest reason this is suspicious?
✅ Mark Day 41 complete
You can now recognise the three injection families on sight, read the telemetry that betrays them, and hunt injected code in a memory image — the understanding that makes you sharper on both sides.
❓ Frequently asked questions
What is process injection in simple terms?
Does this lesson teach me to build an injector?
What Sysmon events reveal injection?
What does Volatility malfind actually find?
Why can’t my EDR just block all injection?
Why learn the detection side in an offensive course?
📚 Further reading
- DLL Hijacking — Day 40 — the sibling technique; the same “trusted-process” detection instincts apply.
- Credential Harvesting — Day 42 — where attackers go after injecting into a high-value process.
- Build Your Lab — stand up the isolated environment every exercise here needs.
- External: MITRE ATT&CK T1055 — Process Injection — the authoritative reference for the technique and its sub-techniques.
- External: Sysinternals Sysmon — the free telemetry engine every detection here relies on.